In this process of working with Chinese data, I was faced with the task of analyzing a lot of spatial data about Chinese provinces, and in this process I had to write a lot of R code. After a while, I got annoyed by how long the process would take, and as a result I took the liberty of designing an R Shiny application to help do some of the heavy lifting. Fortunately, these applications are all hosted on the cloud, and you can find the China Mapping Application here:
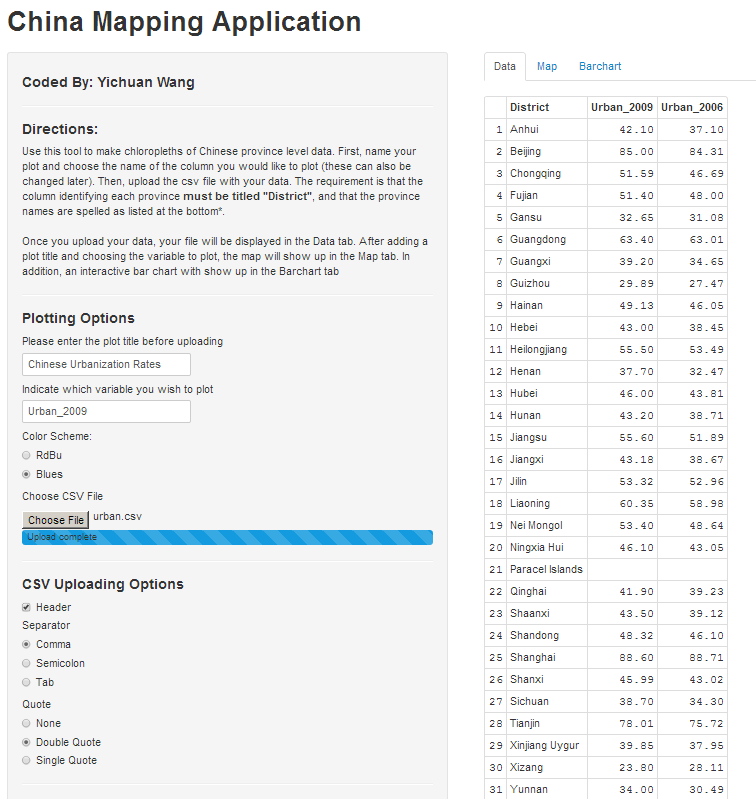
To give you an idea of how it works, after you upload the csv file you will see a screen like this showing you the data:
You can go directly from there to see the map. This was done using the GADM databases for the shapefiles and then the spplot package to render the drawing. Spatial rendering is expensive, so this should take around 60 seconds to do:

And finally, you can go to the interactive bar chart and observe the distribution of your data. This was done using the rCharts package, which creates javascript visualizations using just R code.

If you want some data to play around with, you can take a look at the two dropbox links on China on my data page.
Anyways, I hope my fellow China researchers can enjoy the tool, and if anybody has any suggestions feel free to tweet me at @yichuanw or leave a comment below.
Edit: For those of you interested, the source code can be found here.
I love what you've built here. I'm just getting into R programming myself, could you perhaps recommend a book for learning data mining/analysis/viz in R?
ReplyDeleteThere are many: Probably the quickest practical hands-on would be:
ReplyDeleteSimple R - Using R for Introductory Statistics by John Verzani
http://cran.r-project.org/doc/contrib/Verzani-SimpleR.pdf
J Carson
Ottawa, Canada