
Illegal immigration to the U.S. ended a decade ago and, according to the Pew Research Center, has been zero or negative since its peak in 2007:

Now, my Twitter buddy Lyman Stone of the USDA has written a post alleging that my post is "bad" and "false". Well, my mom always told me "Son, don't **** with the USDA," and that advice has served me well for many years. However, given the importance of this issue, I may have to ignore my mother's wise words, and rebut Lyman's post. Which won't be that hard to do, because Lyman, being the perspicacious fellow he is, in fact agrees with me on almost every substantive point.About a million undocumented immigrants left the country in the Great Recession. But even after the end of the recession, illegal immigration didn’t resume.
In which Lyman agrees with me on essentially everything important
I'm just going to shamelessly cherry-pick the parts where Lyman agrees with me and then goes on to cite more evidence in support of my thesis:
[Noah's evidence shows] that the illegal immigrant population has fallen since its peak. I 100% agree there. He’s totally correct. The stock of unauthorized residents in the US is almost certainly well below historic highs...
Pew gets their estimate [of the number of unauthorized immigrants] by starting from American Community Survey 1-year estimates of the foreign-born population, then subtracting naturalized citizens. Then they use non-ACS data to estimate how many non-citizens are lawful permanent residents (LPRs) or legal temporary residents (LTRs). The residual must be unauthorized residents.
This is the best method we have available and Pew does very good work. I have no criticism of Pew’s estimates insofar as they go..
Now, again, we can say with substantial confidence that the illegal immigrant population was declined since 2007...
Let me be clear. I think Noah is [quite a handsome dude, and is also] correct that net migration of illegal immigrants has been negative in some periods since 2007. And I am very confident that he is correct that the illegal immigrant population is falling...
What frustrates me is that Noah’s basic point, that illegal immigration is a vastly smaller problem now than 10 or 15 years ago, is totally correct. There’s tons of data to support it...He could have just shown the trend in border apprehensions, or shown the illegal immigrant share of the population, or other kinds of data. If he really wanted to be clever, he could have just lined up border apprehensions with deportations by fiscal year to see what direct migration trends might look like...OK, I might have taken a few liberties there with the brackets, but the point is, Lyman agrees with me that according to the best estimates we have available, the population of unauthorized immigrants in the U.S. has fallen from its peak. Given that he agrees with both my thesis and the substance of my point, it strikes me as a bit odd that he characterizes my post as "false" and "bad", but as a man who once pasted Paul Krugman's head on a giant cartoon robot, I probably shouldn't criticize bloggers' use of hyperbole.
Lyman is also right that if I expressed the unauthorized population as a percent of the total, the decline would be even more stark. I'm not sure what increased border apprehensions tell us.
So, to reiterate, Lyman agrees with my basic point. The rest of his post consists of A) quibbles about vocabulary and messaging, B) a dubious point about error bars, C) an interesting but ultimately non-game-changing point about mortality, and D) bikini pics of Jim Heckman from 1971.
Well, no, not (D). Lyman's many things, but he's no monster.
Like, dude, what does "illegal immigration" even mean?
First, note that following Bloomberg convention, I say "unauthorized immigrants" as the noun and "illegal immigration" as the verb. Because an act can be illegal, but a person can't (though I'm sure Jeff Sessions is working on it). So git off my back, y'all SJWs.
Anyway, when we talk about "the amount of illegal immigration", what does that mean? It could mean a couple things:
1. Gross illegal inflows: The number of people who enter the U.S. illegally or overstay their visas over a given period of time
2. Net migration of unauthorized immigrants: The number of people who enter the U.S. illegally or overstay their visas, minus the number of unauthorized residents who exit the country, over a given period of time
What the Pew numbers report, and what I reported, was neither of these. I reported the net change in the unauthorized resident population, That is similar to #2 above, but also includes the effect of mortality (as I'll talk about in a bit).
Anyway, which number do people think of when they hear "illegal immigration"? I'm sure some people do think of the first one. If you're a law-and-order type who is really upset about our porous border, then I'm sure you care about gross flows across that border. Lyman thinks that gross illegal inflows = the One True Definition of the term "illegal immigration":
The point is, everyone who works in this field, all the actual experts, including the folks at Pew whom Noah cites, use “illegal immigration” to refer to inflows which do not have legal authorization. That’s what the term means. It’s not just me. Here’s dictionary.com:

It means inflows. Exclusively.
But that's not the point. The point is come on, brah, my Bloomberg post wasn't fooling anybody. First of all, I define exactly what I mean by "illegal immigration", because the graph is labeled "Annual change in unauthorized immigrant population". It's right there in the graph! I defined my terms! Neener!!
Second of all, that graph has negative numbers on it. How big of a
God, I hope not. Please let there not be such a reader. But if there is, I'm not sure what it would take on my part to avoid misleading him.
OK, down to brass tacks. What number should we care about here?
Like I said, if you're the type of person who lies awake at night fuming that someone managed to sneak past the almighty Border Patrol unnoticed, then you care a lot about gross illegal inflows. I don't, really. Oh, I think there are a few reasons to care - linguistic assimilation, for example. If the unauthorized population keeps getting switched out, it'll slow the rate at which that population becomes proficient in English, the language of
But overall, what I mostly care about - and what I think everyone else should mostly care about - is the stock of unauthorized immigrants living in the country at any given time. First of all, this is what should matter for labor markets. The data has convinced me that the labor market impact of low-skilled immigration is small, but I'm not 100% certain of that, and even a small negative impact on America's most vulnerable workers is bad. But it's the stock, not the gross flow, of unauthorized immigrants that should determine the severity of labor competition faced by low-wage American workers.
Also, the stock is what matters for the welfare state. Low-skilled immigrants probably take as much or more in govt benefits as they pay into the system in taxes, so unauthorized immigrants put pressure on the sustainability of the welfare state. But again, it's the stock, not the gross flow, that matters for welfare payments.
So if what I care about is the stock, why do I talk about changes in the stock? Why do I act like there's no problem just because the stock is hovering at a constant number?
It's all about urgency. If the total number of unauthorized immigrants isn't increasing, there's no reason to panic. There's no reason to start calling for a big shift in our immigration policy. The Obama approach of increased border security and increased criminal deportations is doing a great job of keeping the U.S. from being swamped by illegal immigration, even if it didn't do a great job of winning anti-illegal-immigration voters over to the Democrats.
So I feel like by using the term "illegal immigration" to mean "the change in the total number of unauthorized residents", I was getting at the quantity that really matters.
Did I ignore margins of error?
Yeah. I reported point estimates without talking about margins of error. Let he who is without sin cast the first Stone.
SEE? It was a pun! Lyman's last name is Stone! Get it?? BUAHAHAHA
...OK, anyway. Let's talk about margins of error. Lyman produces a graph of year-on-year changes in unauthorized immigrant population with some error bars he cooked up:

Wow, what looks like zero could actually be an increase of half a million unauthorized immigrants per year, right??
Wrong. The errors don't add up over time. If Pew were measuring border crossings and using that to infer the total unauthorized population, then yeah, the errors in their estimates would cumulate. But what they're doing is re-measuring the unauthorized population over and over each year. Which means that if we want to measure the change in total unauthorized population between Time A and Time B, we don't care about any of the measurement errors in between A and B.
(Random note: Blogger's spell-checker doesn't recognize "cumulate". What sort of fallen world do we live in?)
OK, anyway. I don't know how Lyman produced the graph you see above, since he doesn't include his methodology. It sort of looks like he just added up Pew's standard errors on the yearly population estimates for each pair of years, and then added maximum potential rounding error to each year. But I am an honorable man, and Lyman is an honorable man, and I would never accuse him of making such an undergrad-level math mistake.
In any case, let's talk about how you calculate the error bars of a difference.
So, let A be the total number of unauthorized immigrants in 2007, and B be the number in 2014. What we're interested in is the quantity B - A. We have unbiased estimates of B and A, and some random measurement errors e_B and e_A:
Bhat = B + e_B
Ahat = A + e_A
Suppose we want the variance of the difference between our two estimates: Var(Bhat - Ahat) = Var(e_B - e_A) = Var(e_B) + Var(e_A) -2Cov(e_B,e_A)
So the more correlated our measurement errors are between 2014 and 2007, the smaller the error bars will be on the difference of the two estimates. This is a fancy way of saying that if we miscount by the same number of people each year, we get the change in the total number of people exactly right, even if the amount we miscount by is huge.
I was going to try to write down an expression for serially correlated errors here, with an autocorrelation coefficient of f, so I could use Cov(fe,fe), but I was too lazy.
So the more serially correlated the errors in the ACS and CPS estimates (which are used to derive Pew's estimates) are, the smaller the error bars should be on the difference between the estimates for two years. And I do suspect there is some serial correlation there. Suppose there's some group of unauthorized immigrants that these surveys reliably miss every year. Even if these groups are large - say, 1 or 2 million people - the fact that they aren't measured adds only a little bit to our uncertainty about the change in the total unauthorized population. (That little bit comes from the change in that unobserved subpopulation itself.)
So that's one potential problem with what Lyman is doing here. A second is that he discusses rounding errors. Pew's numbers are rounded to the nearest 100,000, meaning that they can be off by 50,000 in a given year. But those rounding errors obviously don't add up over time! When calculating the change in the unauthorized population over N years, you only have two rounding errors, not N rounding errors.
The third thing Lyman overlooks is that the intervening years between 2007 and 2014 actually do contain some information. They show remarkable stability:

If the measurement error of the yearly first differences were really on the order of 400,000 per year, as Lyman's graph shows, we'd expect to see the numbers jump around a lot more than they do. In fact, after 2008, we never see changes that big. This means Lyman may have made a mistake in how he calculates his error bars, but it also means that Pew may have overestimated its own error bars for the yearly population numbers. (Unless ACS and CPS are smoothing these numbers year to year in some way I am unaware of, which would be a bit naughty!)
Anyway, it's possible that measurement error concealed a moderate amount of (net) illegal immigration between 2009 and 2014. But given the likelihood that the ACS and CPS miss a lot of the same people each year, the number is unlikely to be big. And there's still basically no doubt that (net) illegal immigration was negative between 2007 and the present.
Outmigration to Heaven
As Lyman points out, there are multiple reasons the unauthorized population can decline. One is that people leave the country. Another is that people die. In my Bloomberg View post, I ignored mortality.
The reason I ignored it was that I didn't think of it (an excellent reason, if I do say so myself). But thinking about it later, I confirmed that it isn't that big of a deal, quantitatively.
The crude death rate for unauthorized immigrants is about 3.9 per 1000, according to this random paper that I got by googling, i.e. The Most Reliable Source Ever. That's close to Lyman's own guess of about half the crude death rate of the U.S. as a whole. Using Pew's point estimates for the total unauthorized population each year, and again ignoring error bars, that's about 357,000 unauthorized immigrant deaths between 2007 and 2014, and about 264,000 between 2009 and 2014.
Let's compare this to the difference in Pew's totals for those years (i.e. what I called "illegal immigration"). The difference between 2007 and 2014 goes from -1.1 million to around -743,000 - still a very substantial decrease. The difference between 2009 and 2014 goes from -200,000 to around +64,000, turning a small decrease into a very small increase.
I still feel justified in saying that (net) illegal immigration halted between 2009 and 2014. As Lyman writes:
Mortality, like adjusting for ACS population estimation errors, has only a small impact.
The impact on Lyman's and my productivity is more substantial.
Summing up
So, ladies and gents and zombie thralls of the USDA Advanced Weapons Program, besides a general agreement with my thesis and main point, what we have here are:
1. A vocabulary complaint
2. An insistence that I'm focusing on the wrong number, which may or may not also be a vocabulary complaint
3. The very real fact that I didn't mention error bars (Bad social science columnist! Bad!)
4. Some dubious and mysterious calculations of error bars
5. That time I almost made a Cov(fe,fe) joke
6. A real, useful point about mortality, which I forgot because I'm a critical theorist dum-dum, but which isn't hugely important in the quantitative sense
I don't feel that I come out of this one looking too bad.
*turns around and sees horde of zombie USDA attack cows converging*
Gulp.

Update
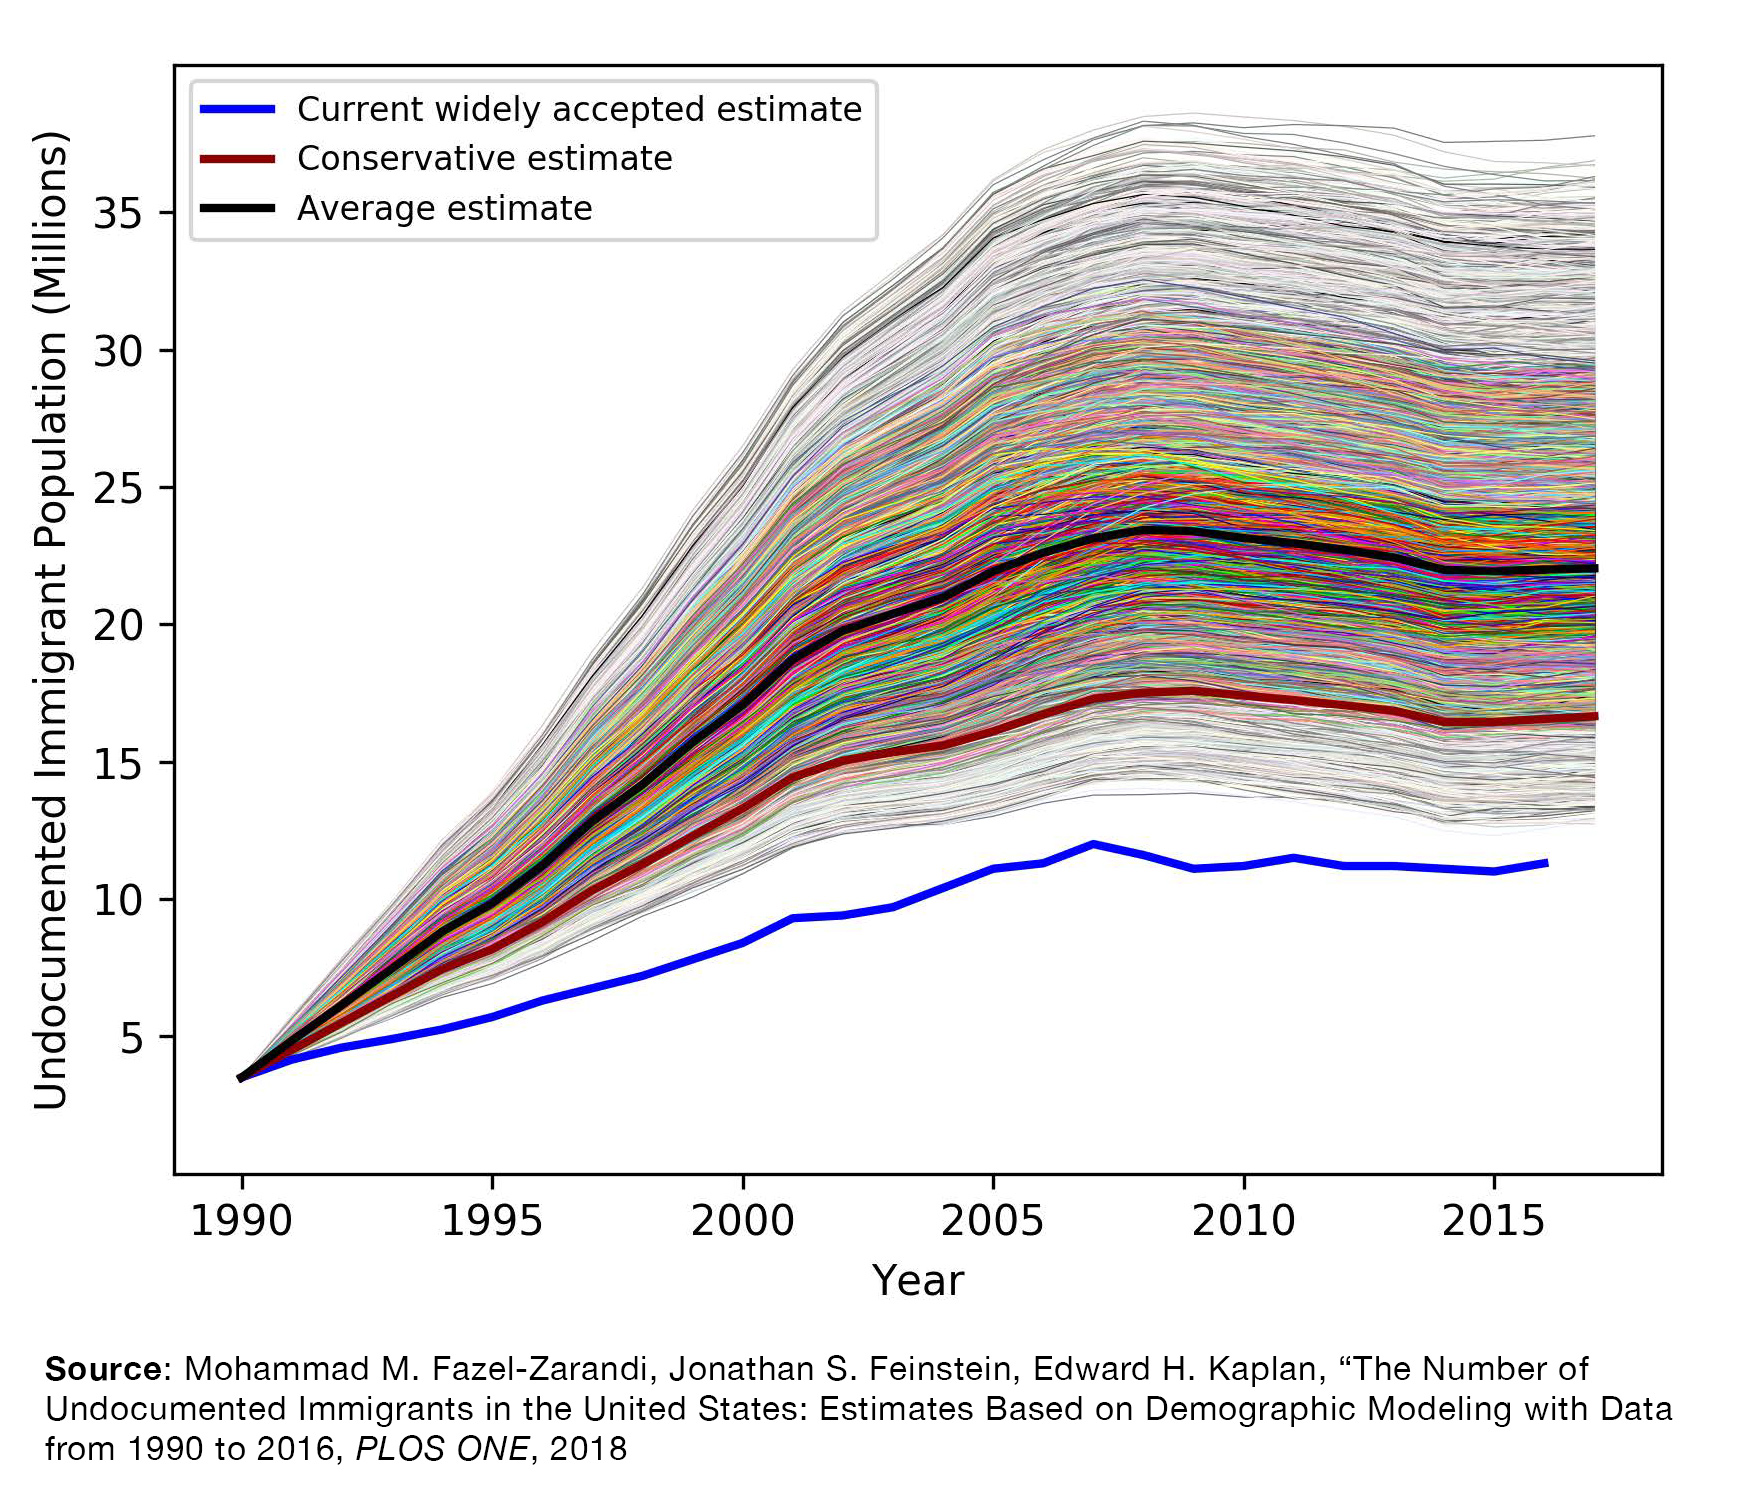
A new study from a group at Yale illustrates my point perfectly. Using inflow/outflow data instead of survey data, they estimate the number of unauthorized residents in the U.S. at around 22 million, about TWICE the official number. But their estimates show the same net decrease from 2007 to now as the survey data show:
Remember, big measurement errors in levels don't generally translate to big measurement errors in changes, due to serially correlated measurement errors (in this case, tending to miss the same people in each survey).
Great post as always! Stay as active as you are handsome!
ReplyDeleteExcellent post, so funny. Also, you have a 2017 instead of 2007 when you talk about the covariances.
ReplyDeleteThanks, fixed!
DeleteFirst Lyman and who is next? Cochrane??
ReplyDeleteYep, Cochrane is next...
Delete> I was going to try to write down an expression for serially correlated errors here, with an autocorrelation coefficient of f, so I could use Cov(fe,fe), but I was too lazy.
ReplyDeleteHey, did you know that cov(F, E(F|E)) = cov(E(F|E), E(F|E)) > 0, so there's no such thing as a negative cov(F, E(F|E))?
https://twitter.com/danielxvarga/status/872320943636574209
I have the best commenters.
DeleteNoah, I did some digging on google as well. The 3.9 deaths per 1000 seems to be the only estimate on crude death rates for undocumented immigrants.
ReplyDelete"Mortality--estimates of the annual number of deaths to the resident undocumented immigrant population. The estimates were derived using an annual crude death rate of 3.9 per 1,000, which was computed using a modified age distribution of IRCA applicants and age-specific death rates of the foreign-born population."
https://www.dhs.gov/sites/default/files/publications/Unauthorized%20Immigrant%20Population%20Estimates%20in%20the%20US%201996.pdf
Thanks for another great article, Noah. Hey, though, we need some perspective on the new minimum wage study that just came out of Seattle.
ReplyDeleteDude, before I start:
ReplyDeleteRepeatedly referring to human beings as "stock" is not going to win you any points in my judge of character book. Unless the writer means it as the "supply or quantity of something accumulated or available for future use" definition and he (wonkishly) considers the population of undocumented persons as a future asset to the economy.
I agree that he's obsessing over language, and not for the right reasons. You should obsess over language when you have a legitimate concept to explore. Stone appears obsessed over coming across as a holdover conservative who obviously knows his society was slow to come around, but he refuses to cross over the bright line in favor of etymological quibbles. Either that or he’s just a wonk.
Legitimate(?) question for the other readers. Is the exchange between Smith and Stone a metaphor in some way for a Macro vs Micro viewpoint?
A few quick observations of his piece:
“Gross rates matter independently of net rates because even temporary migration has effects on the United States. “ - Does this matter?
He loves the word egregious
A quick observation on yours:
“But it's the stock, not the gross flow, of unauthorized immigrants that should determine the severity of labor competition faced by low-wage American workers.”
- Simple narrative to reveal why a population’s labor competitiveness value (is this a thing?) can increase whereas the total number of said population stays the same. The stubborn and successful stay put; the waifs and the dejected go “home”.