
Here's another point in the ongoing debate over the fate of the American middle class in recent decades (installment 1 here, installment 2 here).


In his original post, Brad DeLong wrote:
Across most of the income distribution Americans today are little if any better off than their predecessors back in 1979...For 150 years before 1979 Americans had confidently expected that each generation would live roughly twice as well in a material sense as its predecessor, not find itself struggling against the current to stay in the same place.
In my previous posts, I pointed out that median household income had increased. But let's just look at median individual income. Was 1979-2000 really worse than the postwar period, for the average person?
Let's look at the relative performance of the period, not its absolute performance.
I found this cool graph from the Russell Sage Foundation. Using Census data, it shows inflation-adjusted median and mean household and individual income, starting in 1947:
Median individual income in constant 2012 dollars is the green time series. I drew three horizontal lines, corresponding to 1947, 1979, and 2000.
From 1947 to 1979, real median individual income went from around $16,000 to around $21,000 - a total increase of about 32%. That is a compound annual growth rate of about 0.8%.
From 1979 to 2000, real median individual income went from around $21,000 to around $28,000 - a total increase of about 33%. That is a compound annual growth rate of about 1.38%.
Let's do a comparison that's a little more favorable to DeLong and Thomas' argument, and a little less favorable to mine. Let's use 1972 as the end of the "good" times and 1972-2012 as the "bad" times.
From 1947 to 1972, real median individual income went from around $16,000 to around $23,000 - a total increase of about 48%. That is a compound annual growth rate of about 1.46%.
From 1972 to 2012, real median individual income went from around $23,000 to around $27,000 - a total increase of about 17%. That is a compound annual growth rate of about 0.4%.
Finally, From 1979 to 2012, real median individual income went from around $21,000 to around $27,000 - a total increase of about 28%. That is a compound annual growth rate of about 0.76%.
You can play around with these numbers more, but several conclusions emerge:
Conclusion 1: If you go by personal rather than household income, it is not true, as Brad asserts, that the average American saw his or her material standard of living double in the Postwar period.
Conclusion 2: The period from 1979-2000 - the Late 20th Century Boom - was about as good for the average American's income as the Postwar Boom period from 1947-1972. The Postwar Boom wins, but only slightly, since both booms have fairly high compound growth rates.
Conclusion 3: The Total Postwar period, from 1947 through 1979, is almost exactly the same as the Total New Gilded Age from 1979-2012, although both have fairly low compound growth rates.
Conclusion 4: The Late 20th Century Boom thoroughly thumps the Total Postwar Period (1947-1979) in terms of the growth in the material standard of living of the average American.
Conclusion 5: The 1970s was bad, but was over quickly. The Post-2000 period has also been bad, and is stretching out for longer than the 1970s.
In other words, Brad DeLong's contention that the average American saw a dramatic slowdown or reversal in the rate of growth of his or her material standard of living in 1979 is not supported by this evidence. And his contention that the Postwar rate of growth in material standard of living represented a generational doubling is not correct, if you exclude the effects of technological improvements. It was more like a 33%-50% increase.
And my contention that the period from 1979-2000 was a great time for the average American's material standard of living is correct, if you compare it to the period from 1947 -1979, and even looks pretty good if you compare it only to the best Postwar decades.
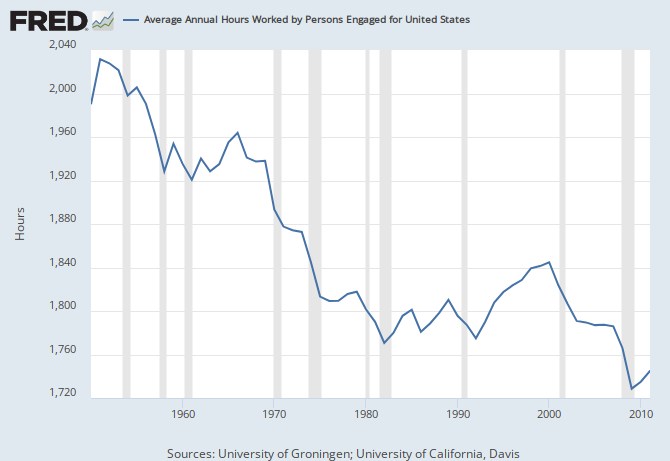
Again, this is not accounting for leisure and home production. But observe that the Postwar period, just like the period from 1980-2000, saw a steady increase in the percent of women in the labor force:
Therefore, hours spent on home production were decreasing at about the same rate in the Postwar period as in 1979-2000. In other words, although women's workforce entry contributed more to rising income in 1979-2000 (because women's wages had converged somewhat with men's by then), the rate at which household production hours were sacrificed - the rate at which women exited the home and went into the workforce - was roughly the same in both periods.
So as I see it, the entire case that 1979-2000 represented a dramatic slowdown in the growth of material living standards relative to the Postwar period rests on the fact that leisure increased during the Postwar but flatlined during 1979-2000:
If you want to make the case that the American economy did dramatically worse for the average American in 1979-2000 than in 1947-1979, this is the most convincing case I can think of.
(Note: I still think the Postwar period represented a much bigger jump in the welfare of Americans, since marginal utility of consumption is concave. Getting food on the table, warm clothes, and a roof over your head is vastly more important than getting a bigger house, a second car, etc.)
Can we take a step back? Because from 1947 until the late 2000s (presumably 2008 or 2009), there's a clear upward trend. The growth rate varies a bit, and there's a here and there dip for recessions or the stagflation years, but overall, clear growth trend.
ReplyDeleteThen there's a big dip.
Seems like the big dip is a bigger issue.
Yep. I agree.
DeleteThere was also a big dip in the seventies.
DeleteYep, but the 70s dip was over more quickly. We're into the 15th year of our new dip.
DeleteHow do we define the period? From the graph, it looks like the green line was no higher in 1981 than in 1965, for example, and it looks like it took till mayne 86-87 to regain the peak of 72-73?
DeleteI find it especially surprising that you would make this sort of post, especially since you would label yourself a left winger. I certainty would not expect this post from someone on the left. I complement you on how non-ideological you are.
ReplyDeleteAs a right winger, I am trying to behave the same.
By the way, if your interested, the book "Myths of the rich and poor" (written by right wingers, I feel I should note) has a wonderful one page table that is dozens of lines long, that lists all of the massive changes in consumption purchases that have happened in the last several decades.Think you might find it interesting.
ReplyDeleteI vaguely thought GDP growth rate was roughly equivalent to wage growth, and that both were around 2%. So you're saying wage growth is less than 2% pretty much since 1945?
ReplyDeleteSo population growth is really the big driver in US GDP? Am I missing something? (Quite likely.)
GDP growth is average, not median, so big increases at the top of the distribution make a difference.
DeleteThanks for explaining.
DeleteThat's what I'm here for!
DeleteWell, that and making fun of various people. :-)
Is this not a variation on Piketty's main observation?
DeleteLooking back at installment one I can see that it's already bunk: look at Warren's The Coming Collapse of the Middle Class for a discussion or the change in housing composition. And as she makes clear, the fact of the matter is that building has shifted from starter homes to more, er, 'upscale' housing because that's where the money is. Over the last thirty years modal housing size has increased by either one bedroom or one bathroom . . . but not both. So much for your conclusions based upon increasing square footage.
ReplyDeleteAren't you supposed to be an economist? With a PhD? And doesn't this imply that you would be engaging in, uh, scholarship?
Aren't you supposed to be an economist? With a PhD? And doesn't this imply that you would be engaging in, uh, scholarship?
DeleteNo, that would be if I were writing a paper for a journal, which anyway wouldn't be interested in a historical summary like this.
But I try to be careful and look at the best evidence.
And median house size is not modal. I guess rich people have multiple houses, so the median house is not the house of the median earner. But modal is a weird measure...
Ah, the 'This isn't a scholarly thesis' defense. No, it isn't; it's a blog post where you're supposed to have done some minimal research. Note that 'minimal' is not a synonym for 'no'.
DeleteI also notice you're not explicitly admitting you were wrong about what increased housing size implied. Spare me the 'this isn't a scholarly article' defense; I'm just asking for a minimal amount of good faith. And, uh, didn't you claim greater-than-average statistical expertise? Think: why are clothing retailers interested in modal size?
Really, none of this is hard stuff. More to the point, this is supposed to be your field. That I can spot the errors in a matter of seconds (I'm an algebraic geometer, not a physicist) is perhaps evidence that you should be more careful about what you write.
Algebraic geometer, not an economist, that is :-( Sorry. Long day.
DeleteAh, the 'This isn't a scholarly thesis' defense. No, it isn't; it's a blog post where you're supposed to have done some minimal research. Note that 'minimal' is not a synonym for 'no'.
DeleteThat sounds aggressive, but is it smart? I quote a number, you say you don't like it and you vaguely half-quote a number that may or may not imply something different, fail to provide a link, and start throwing taunts. That's par for the course for the comment section, of course but an algebraic geometer should show a little more rationality... :-)
I also notice you're not explicitly admitting you were wrong about what increased housing size implied.
Of course not, because no one showed any evidence, yet, that I am wrong. Got any?
Really, none of this is hard stuff. More to the point, this is supposed to be your field. That I can spot the errors in a matter of seconds (I'm an algebraic geometer, not a physicist) is perhaps evidence that you should be more careful about what you write.
blusterblusterbluster
Still no evidence...Throw me a link, algebro!
Sigh. No, criticisms are not 'aggressive'. They are criticisms. Nor do I have to prove you wrong (though my link, which you obviously have no intention of following, does so in spades); this is your thesis and the burden of proof falls on you, not I. Moreover, I refuse to believe you do not know this; hence your "if you can't make me say I'm wrong I win" schtick is trolling on the order of Megan McArdle . . . Noah, if there's one thing the world doesn't need, it's another Megan McArdle.
DeleteIn the meantime: your installment one is, as I said bunkum -- and easily seen bunkum at that. You want me to think otherwise? Then I suggest you put more effort into your posts. Mmmm . . . a cursory google search indicates I'm not the first to voice these sorts of criticisms. Hopefully, I'll be the last.
Link is to a book. You want me to go buy a book, read it through, and (hopefully, possibly) find (something akin to) the factoid you threw out. Nice try, hoss.
DeleteLink or it ain't real.
and the burden of proof falls on you, not I
That should be "on you, not me". The first person pronoun for the object of a preposition is "me", not "I".
Moreover, I refuse to believe you do not know this; hence your "if you can't make me say I'm wrong I win" schtick is trolling on the order of Megan McArdle . . . Noah, if there's one thing the world doesn't need, it's another Megan McArdle.
blusterblusterbluster
In the meantime: your installment one is, as I said bunkum -- and easily seen bunkum at that. You want me to think otherwise? Then I suggest you put more effort into your posts. Mmmm . . . a cursory google search indicates I'm not the first to voice these sorts of criticisms. Hopefully, I'll be the last.
Blusterblusterbluster
Still zero substance, zero evidence, lots of bluster
*yawwwwwn*
What happened, "algebraic geometer", is this:
Delete1. You read a post you viscerally didn't like.
2. You remembered something from a book you read that sounded like it contradicted one part of the post you didn't like, but you couldn't quite remember the numbers or where they were.
3. When called out on this you decided to bluster and hurl insults ("another Megan McArdle") rather than back up your arguments with evidence (which is risky because you might be shown to be wrong).
This is all standard stuff for blog comment debates, but try thinking with your brain instead of your balls. Go look for evidence to back up your claim. Send links to it. If you turn out to be wrong, or partially wrong, just acknowledge it. If you turn out to be right, I will certainly acknowledge it.
I think we've progressed past the Tycho Brahe era in terms of resolving arguments, don't you?
If you say things have got worse since 1979, you are saying that the basket of goods you could purchase back then is superior to the basket of goods you can purchase with your current wages.
ReplyDeleteThat is, you would be better off travelling back in time to 1979 because the superior basket of goods you can purchase from your wages.
How much would you pay to go back to the 1970s or whenever you define as the good old days to spend your wages on a superior basket of goods will?
A way to grasp the conceptual difficulties of measuring changes in living standards and life expectancies across the decades is to step into Brad De Long’s time machine, which he put forward in his draft history book Slouching Towards Utopia.
In his thought experiment, De Long asks how much you would want in additional income to agree to go back in time to a specific year. De Long was an economic historian examining the differences in American living standards as compared to 1900..
De Long would have refused to go at all to 1900 unless he could at least have taken mid-20th century modern medicine with him. Otherwise, it would have meant dying from a childhood phenomena.
I would have probably died from appendicitis if I was a teenager in 1900. Instead, I spent 10 days in hospital in the 1970s. Not sure about the diabetic medications in the 1970s either.
I dont get it - last time it was the supposedly awesome performance of household income, now its individual income. The regime change in the family income growth rate around 1973 is quite visible in the above graph. It is also visible that it is a lot more pronounced for the family income than individual income and that Avg. and Median grew approximately the same rate before 1973. Together with the end of Bretton Woods referencing to 1973 makes a lot more sense here, than just picking a trough date.
ReplyDeleteA logarithmic plot would make things a lot clearer when arguing about growth rates.
While it is true that stagnation has not been total, compared to GDP growth the rise in family living standards has been disappointing. And it is not getting better.
A very narrow single anecdote:
ReplyDeleteMy father was working class, a foreman in a factory. I graduated in 1970 from medical school with no debt. This is hard to duplicate today.
If the market basket includes education and career prep, then the middle class is worse off.
Yes! What about student debt? Obviously, since the increase of the mean is stronger than the increase of the median, income growth at the top was higher than income growth at the bottom (where there might have been no growth at all). People with higher income, especially the upper middle class as opposed to the lower middle class (Noah agrees that in this context the middle class is in the process of being split in two.) are probably those who studied and accumulated debt. The increase of student debt in the USA has been horrific. As a consequence, more income is needed to repay debt, so even if total income increased, available income might be much lower.
DeleteLet me repeat it, one should take a look at available income, not just income. If a college education is necessary to participate in the process of increasing incomes, then student debt is an almost inevitable consequence. The promise of a better life needs to be paid for with an even longer delay in higher consumption.
Ohhkay, just forcing me to spend more time on this…when my wife's not looking.
ReplyDeleteAnywho, looks interesting, I'll get to it as I can. But before this expires in blogtime in a day or two:
"Finally, From 1979 to 2012, real median individual income went from around $21,000 to around $27,000 - a total increase of about 28%."
I'd really like to see the stat for just men's individual income. I believe I've seen that women's individual median income went up substantially, but men' went up little, or even went down -- over 35 years, when you'd expect gigantic advance in a high tech age.
Next, does this include benefits? If it's income including benefits, how much of this is healthcare, which went up enormously? Now, to me especially, there's an enormous advantage to living in the most recent time in the so much more advanced technology and medicine, but still, especially at the median income, if so much of your limited income is going to health insurance and health care, this can really create a lot of stress, even so much that it's not worth the improvement in care with the new tech.
And again, consider the much greater costs of education and preparing a child to compete in so much more demanding and dangerous a country. This can be thought of as a cost of business, an intermediate input, not consumption, and I think it mostly is to many people, even if to you and I, we very much consider education a pleasure and benefit in of itself.
I'd like to see income net of medical costs, net of education costs, net of employment costs (like needing two cars now for two workers) and to see this as a ratio of housing expense. This kind of really getting into the data and working with it is what's really needed – but if you can't get it into a pub in a "respected" journal you risk brutal penalty spending time on it. Hopefully someone can and does, and has really studied and analyzed this data.
"I'd really like to see the stat for just men's individual income."
DeleteIt's in the charts that Noah linked to.
It's actually fairly amusing watching Noah crap all over his own credibility. Next he'll be bashing climate science.
ReplyDeleteIt's well established that wages tracked productivity closely from WWII to about 1973 , and decoupled thereafter. That means that if you worked 40 hrs in the 40's and 40 hrs in the 70s , your standard of living roughly doubled in between those periods.
http://portside.org/sites/default/files/styles/large/public/field/image/productivityVsPay-figurea.jpg?itok=XvbmhMFE
from Mishel et al :
http://portside.org/2015-01-10/erosion-collective-bargaining-has-widened-gap-between-productivity-and-pay
You'll see a lot of rightwing crap about deflators and such , as they try to shrink the pay-productivity gap - just ask Noah , he'll know where to find it. Kenworthy doesn't think it explains much :
http://lanekenworthy.net/2012/03/11/is-decoupling-real/
Good stuff. I'm still looking for some good quintiles income data - please post it if you find anything like that, Noah!
ReplyDeleteWeird question, but why is the median household income figure so much lower than the median individual income figure? If both individuals in a two-income household were earning the median individual income, they'd both have to be working nearly full-time to match the median household income.
Here is something: http://www.cbo.gov/sites/default/files/10-25-HouseholdIncome_0.pdf
DeleteSee page "x" (p.12 in the pdf)
Yes, compare page "x" in Noah's links , showing the changes from 1979-2007 , to these , which also show the pre-Trickle Down era :
Deletehttp://www.stateofworkingamerica.org/chart/swa-income-figure-2c-average-family-income/
http://jaredbernsteinblog.com/wp-content/uploads/2012/03/inc_20_50_95.png
in table format :
http://www.stateofworkingamerica.org/chart/swa-income-table-2-1-average-family-income/
The last showing that , as DeLong claimed , incomes across the distribution roughly doubled between 1947-1979.
Thus the decoupling of middle-class wages from productivity growth and the violent shift in income gains to the top of the distribution show that there's been a huge change in economic outcomes of the middle class between the postwar era and the current Gilded Age , for the worse.
Noah,
ReplyDeleteI'm not economist and that's probably why I don't see why you are using median individual income instead of family median income which seem to support DeLong point. Please could you elaborate on this point ?
Ludovic Coval
I also wonder about this! But my eyeball test says that when you cut out the recession years, the growth rates are pretty similar.
DeleteThoughts?
Read the prior posts and the linked posts.
DeleteOversimplified summary:
DeLong: American economy has been bad since 1979. (http://equitablegrowth.org/2015/01/16/scene-setting-policy-discussion-american-economy-stumbles/)
Smith: Median household income doesn't look like it. (http://noahpinionblog.blogspot.com/2015/01/delong-smackdown-patrol-how-worse-off.html)
Kenneth Thomas: You need to look at individual income because of women's entry into the workforce driving up household earnings. (http://angrybearblog.com/2015/01/what-is-noah-thinking.html)
Smith: How would that work? (http://noahpinionblog.blogspot.com/2015/01/working-women-and-middle-class.html)
Smith: Here's what it looks like with individual income.
Adam,
DeleteThanks for the summary, make things more clear.
Ludovic Coval
Life Pro Tips based on Noah's analysis:
ReplyDelete- Be the type of person that gets married.
- For all you lonely nerds, I recommend OKCupid.
- Get busy.
If you're single you can also do co-housing or live with long-term roommates.
DeleteBut I do recommend having a family, just because it's emotionally healthy in the long run.
But *household* income was below family. So yes, co-housing/long-term roommates is an option, but the best is to date your way out of poverty.
DeleteWell, I generally recommend romance, it's better than the alternative. We need the eggs.
Delete"the best is to date your way out of poverty" - That's what Piketty said! Marry a rich heiress!
Delete"4. According to the Economic Policy Institute, a Washington D.C. think-tank, between 1979 and 2006 (the latest year of available data), the top 1% of earners in the U.S. more than doubled their share of national income, from 10% to 22.9%. The top 0.1% did even better, increasing their shares by more than three times from 3.5% in 1979 to 11.6% in 2006. ... The U.S. growth rate in per capita terms since 1980 has been around 1.8%, which is the same rate as the one seen between 1950 and 1980."
ReplyDeletehttp://blogs.wsj.com/source/2011/08/07/five-false-premises-about-economic-recovery/
Noah, if the growth has not been squeezed out of the middle class -- at least not as much -- maybe it has been that much more squeezed out of the lower middle class and the poor. Witness the dissolving of supermarket union contracts in the face of the unionized Walmart, the multi-dollar decent of the minimum wage and the resulting 100k out of 200k Chicago gang age males in gangs ...
... or the decent of the would-be, had-been middle class, for instance regional airline pilots getting food stamps (nothing centralized bargaining wouldn't straighten out), or the destruction os NY, Chi and SF taxi driver me ...
... In the late 70s I used to pick up $150 a shift in today's money as gypsy or car service driver in the Bronx, ditto in Chicago (got tired of living in the "James Bond Movie"). But, between 1981 and 1997 Chicago allowed one 30 cent increase in the per mile rate, while adding trains to both air ports, opening up unlimited limos, putting on free trolleys between all the hot spots downtown -- and -- adding 40% more cabs. By early 1997 I had emigrated 2000 miles with my own country to drive a cab in San Francisco.
Same story in NYC: last taxi strike, 1976, $2.25 a mile (2004 dollars) -- by early 2004 down to $1.50 a mile (lease system meaning shortfall all out of driver).
Any attention from you for the deunionized, ever more stripped bare half of all of us?
FAR BE IT FROM ME NOT TO SUGGEST MY OWN SOLUTION:
DeleteThe ultimate – federally prosecutable -- sweetheart labor contract may be no contract at all.
No one would doubt the criminality of a mob union boss and/or an employer threatening to fire workers for speaking out against a mobbed-up sweetheart contract – in order to obtain for themselves the pay and benefit moneys that might otherwise have gone to employees through fair bargaining practices. A for certain RICO or Hobbs Act target.
http://ricoact.com/
Why shouldn't the exact same extortionate activity be view in the exact same extortionate light when union busting “consultants” and ownership threaten to strip away workers' economic livelihoods should they dare to participate in a federally approved path to establish federally approved union bargaining rights?
US Attorneys -- Criminal Resource Manual 2403
http://www.justice.gov/usao/eousa/foia_reading_room/usam/title9/crm02403.htm
In current (virtually universal) practice this economically -- and by extension politically -- ruinous extortion is “punished” only under administrative law laid down by the National Labor Relations Board -- and employers found guilty pay only a (usually small) compensation for lost wages (not a penalty).
Alternate route: if any state independently outlaws this form of labor market extortion with a penalty of at least one year in prison, federal prosecution can automatically step in.
Noah, if the growth has not been squeezed out of the middle class -- at least not as much -- maybe it has been that much more squeezed out of the lower middle class and the poor.
DeleteYep. I think the real economic story is that the middle class split into two - one chunk did substantially better, one did substantially worse.
I think there has been a fair amount of pile-on regarding these latest posts, and it seems well deserved. These posts seem kind of shit relative to prior standards (post 2 better than 1, however).
ReplyDeleteIn any case, for a topic like this that has been carefully studied by many prominent economists and social scientists over a long period (Saez and Piketty of most recent fame, perhaps), all of whom generally conclude that there has been sharply rising inequality fueled in no small part by the stalled prospects of the middle classes from sometime in the late 70s to early 80s, it would seem a bit foolhardy to attempt to conclude otherwise (or argue against someone reiterating that assertion) just by means of a superficial examination of some random data at hand.
One assumes that the joint responsibilities of an academic post and a commentary position are rather demanding, and these would likely eat into available research and critical thinking time....
Notwithstanding, Noah has justifiably rocketed up the econ blog space awareness chart, but post like these are pretty damaging.
"Notwithstanding, Noah has justifiably rocketed up the econ blog space awareness chart, but post like these are pretty damaging."
DeleteNot damaging at all - career-enhancing , in fact.
See that link at the top right of the page ? : "Noah Smith on Bloomberg View"
Noah is mainstream media. MM ignored inequality for as long as they could. Now that they can't ignore it any longer , the goal is to minimize any damage ( to the 1%) that might flow from widespread education of the public (the 99%) about why their lives have been getting crappier by the day , for decades.
Don't cry for Noah , America. He knows what he's doing.
But I think inequality is a big problem, and has gotten much worse. That doesn't contradict the fact that median incomes rose in the late 20th century (and not since then)!
DeleteNowadays it's better be a single than couple. Cost of life is too high and redistribution of income is wrong. Obama has right when talk about taxes and the richest people.
ReplyDeletePerhaps you did this, but without including the impact of greatly increasing medical expenses, and more jobs not including coverage, disappearing pensions, threats to Social Security, and more expensive education your analysis is not so useful. Also the impact of very higher housing expenses in most coastal areas limits the usefulness of what you are trying to do.
ReplyDeleteAnd, one could argue that Brad's wrong in taking 1979 as the "split" year, rather than, say, 1972 or 1973. The Vietnam piper being paid, oil embargoes, etc.? A 1947-73 and 1973-2000 split WOULD show better income growth in the first period than the second.
ReplyDelete